Self organization is a concept
where neighboring neurons compete with respect to a given input pattern by
producing some kind of output, and develops adaptively into pattern detectors.
There are many reasons why people
pursuing research in computational neuroscience have much interest in Self
Organized Maps (SOM). We will look into this once we have understood the
principles of SOMs.
Brief intro into SOM:
A self organizing map can learn
how to classify data without supervision. That is the reason for the strong
biological resemblance of this technique and its derivation. This concept was
initially presented in a structured manner by Teuvo Kohonen, a professor of the
Academy of Finland. I will try to provide a high level intuitive idea about
SOMs. If you want the detailed mathematical model you can refer to Kohonen’s
orginal paper (which is very hard to read) or this website. We will discuss the
functioning of a SOM in two circumstances.
A SOM could contain a set of
neurons connected to each other as a lattice. A simple 2D SOM is given in the
following image.
 |
| Figure 1: Basic SOM |
Function of a fully trained map
Although the concept can be
extended into many dimensions, for simplicity let us consider a plane having
NxN neurons 4-connected to its neighbors. Each neuron can be given a k
dimensional vector as input. We provide all the neurons with the same input
vector. The neuron which has an internal structure which is most tuned to the
input pattern will have the strongest output and it will be the designated
winner. We call this as a classification of the input by the network.
The training
This is the most important
attribute of SOMs. As with the classic neural network theory, the structure of
the neuron is fully determined by a set of ‘weights’, and we call this the
weight vector. Assume at the beginning the weight vectors of all neurons in the
lattice are randomly assigned. When an input vector is presented, based on the
weights some neuron will win that round. After winning, the neuron will try to
gradually align itself with the input pattern, so that it will have a stronger
resemblance to the input than before. This is the adaptation step. The
adaptation happens in a way that not only the winning neuron, but the neighbors
are also changed to represent that specific input pattern. But the amount of
change or the potential to change, which we call ‘plasticity’ depends on the
proximity of the neighbor to the winner. The winner has the highest plasticity,
and more distant a neuron is to the winner, plasticity becomes less and the
change minimum. This process continues for a large number of input cycles, and
the system converges to a specific form. As a result of the neighborhood based
adaptation, a spatial organization of neurons appears automatically. In other
words, neurons which are tuned to a specific kind of input would lie close together.
A very simple example would be a
color map, which the input would be the RGB values and the output a
classification of color.
 |
| Figure 2: Color map derived using SOM |
The most important aspect of this
simple model is that can change dynamically based on the statistics of the
inputs. If the input patters change over time, the network will adjust itself
to suit the new patterns. We can interpret the functioning of a SOM as a dimensionality
reduction exercise as well. For example in the above situation, the input is
the 3D vector, whereas the output is a 2D spatial location.
Why are SOMs an interesting area?
One main reason would be Brain
Maps. Through various experiments we have found out that specific areas of the
brain has adapted for specific tasks. This property is called localization. The
localization which is inherent for SOMs could be used produce a ‘brain like’
architecture which is adaptable and exhibit localized functioning.
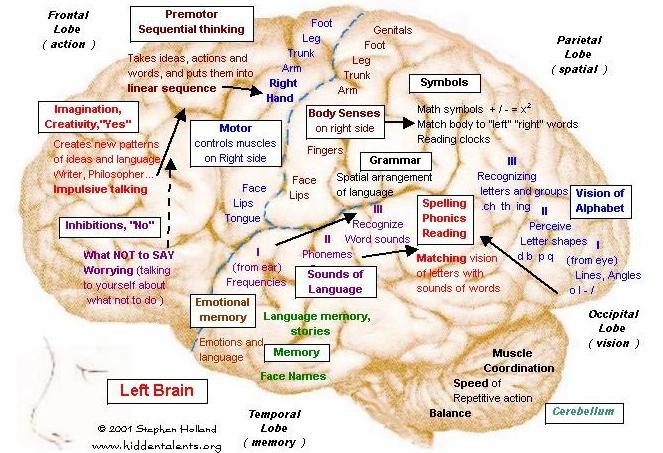 |
| Figure 3: Brain Map |
If we go down in to specific
areas such as the visual cortex, we can
see that a hierarchical division is present. One main section is called the V1
where the light patterns are broken down into different elements such as
oriented line segments, to identify the structure of the image.
This mechanism of breaking down
the image into a form which could be used to identify structure from vision and
further analyzed could be mimicked using an advanced type of SOMs called Adaptive
Subspace Self Organizing Maps (ASSOM). We will have a discussion of this are
in the next post.